
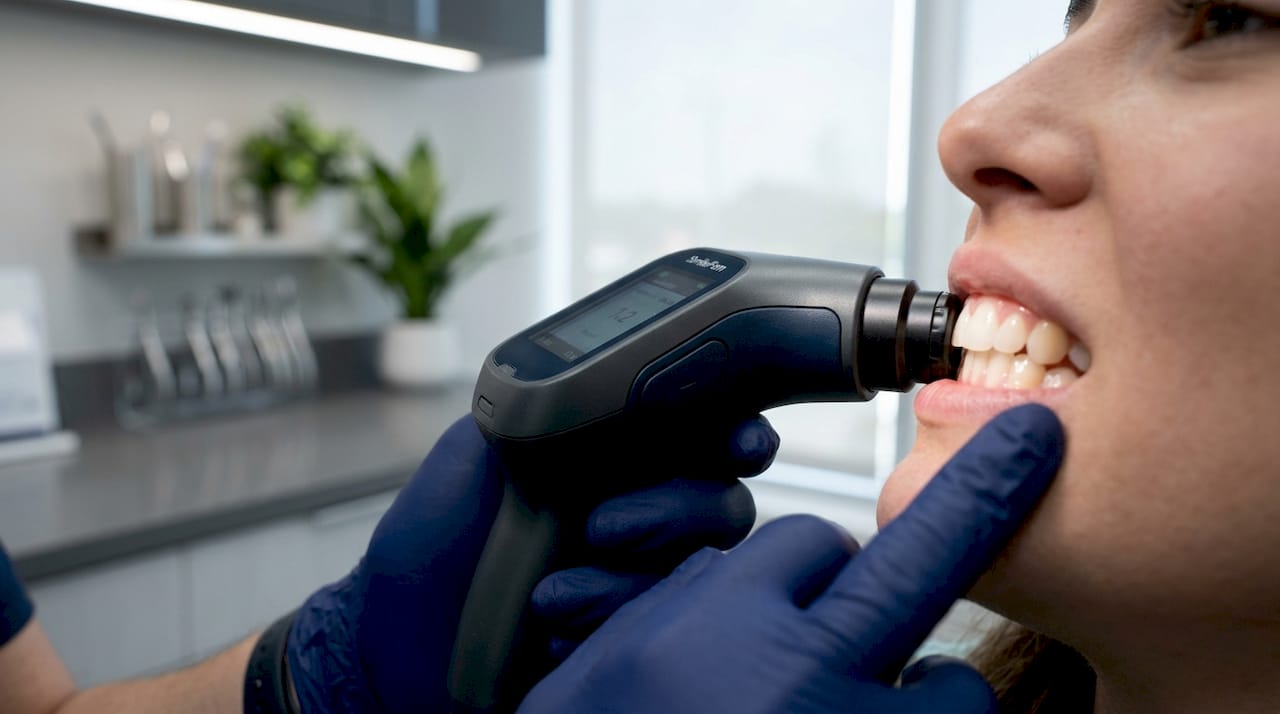
Teeth whitening effectiveness is measured through quantifiable color change assessment using spectrophotometry, visual shade guides, and standardized color metrics. The primary framework is the CIELab color space, which assigns numerical values to lightness and hue, allowing clinicians and researchers to calculate precise color differences before and after treatment. Tools like the VITA Easyshade V spectrophotometer and the Vita 3D-Master shade guide are the industry standards for this evaluation. Whether you are tracking progress at home or reviewing clinical trial data, understanding how teeth whitening is measured gives you a reliable framework for interpreting real results.
How teeth whitening is measured: tools and technologies
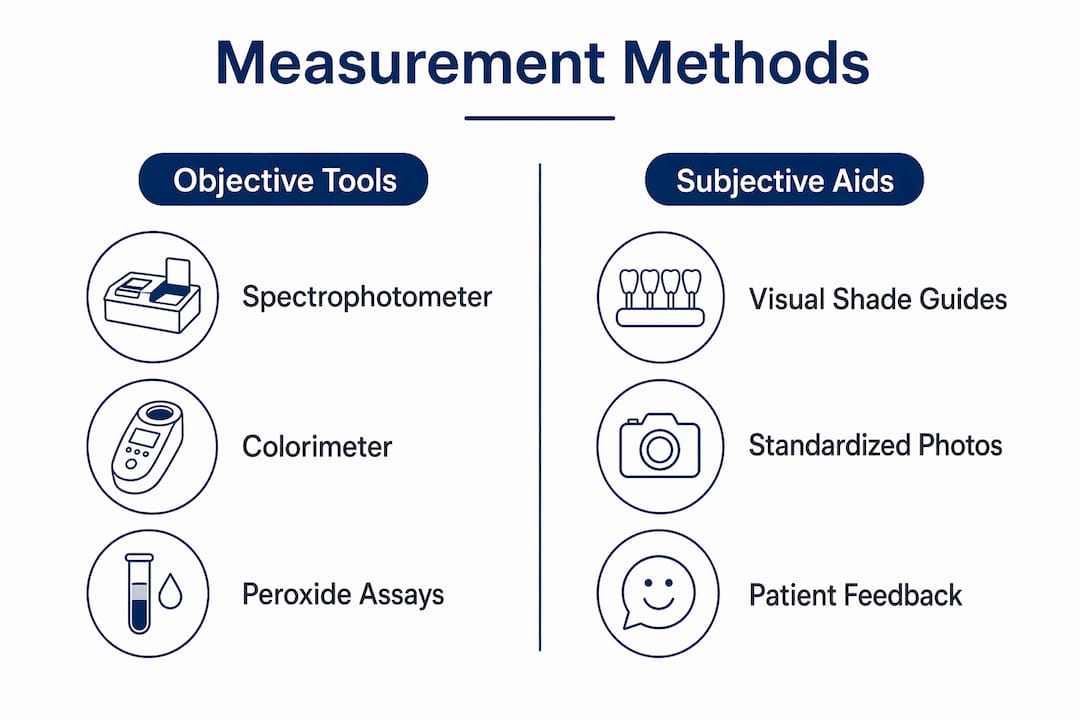
Teeth whitening measurement relies on two categories of tools: objective instruments and subjective visual aids. Each serves a distinct purpose, and the most credible evaluations use both together.
Objective instruments include spectrophotometers and colorimeters. These devices project controlled light onto the tooth surface and analyze the reflected spectrum to generate CIELab coordinates: L* (lightness), a* (red-green axis), and b* (yellow-blue axis). The VITA Easyshade V is the most widely used clinical spectrophotometer, producing L*, a*, b*, and composite W* whiteness index values in seconds. Spectrophotometry with CIELab values is the most objective method available for quantifying tooth color change.
Visual shade guides like the Vita 3D-Master system allow clinicians and patients to match tooth color to a physical color tab. The Vita 3D-Master organizes shades by lightness first, then chroma and hue, which makes it more systematic than older classical guides. Research comparing three commercial shade guides across 212 subjects found that the Vita 3D-Master outperforms classical guides in natural tooth shade matching accuracy for some populations. That matters because a shade guide with poor coverage will underreport whitening progress.
Here is a direct comparison of the two main approaches:
| Method | Tool example | Output | Limitation |
|---|---|---|---|
| Spectrophotometry | VITA Easyshade V | L*, a*, b*, W*, ΔE00 | Cost, lighting sensitivity |
| Visual shade guide | Vita 3D-Master | Shade guide units (SGU) | Observer subjectivity |
| Digital photography | Calibrated camera setup | Visual record, image analysis | Requires consistent conditions |
Pro Tip: When using a shade guide at home, photograph your teeth next to the shade tab under natural daylight. This creates a visual record you can compare at follow-up intervals without needing clinical equipment.
The choice between instruments and shade guides is not either-or. Combining objective and subjective methods produces more complete whitening assessments than either approach alone, which is why leading clinical trials use both.
How are whitening measurements standardized for accuracy?
Standardization is what separates a reliable measurement from a guess. Without consistent protocols, the same tooth can produce different color readings depending on who measures it, where they measure, and under what conditions.
Professionals follow these steps to standardize tooth color measurement:
- Select the measurement site. Readings are taken from the middle third of the buccal (outer) surface of the upper central incisors. This area has the most uniform enamel and the least shadow interference.
- Use a positioning guide. A 6 mm diameter positioning guide holds the spectrophotometer tip at a fixed angle and distance from the tooth surface, eliminating variation caused by probe placement.
- Calibrate the device. Every session begins with a calibration check against a known reference tile. Skipping this step introduces systematic error across all readings.
- Control ambient lighting. Overhead fluorescent lights and direct sunlight both distort color readings. Measurements are taken in a standardized lighting environment, ideally with the device’s own light source isolated from the room.
- Use a single trained examiner. Measurement reliability with ICC exceeding 0.9 is achievable when the same trained operator performs all readings. Switching examiners mid-study introduces inter-rater variability.
- Document with clinical photography. Standardized photographs taken at each time point provide an auditable visual record that supports the numerical data.
Standardized measurement location and calibration are the two factors most responsible for reproducible results. Without them, even an expensive spectrophotometer produces unreliable data.
Pro Tip: At home, take photos in the same spot, at the same time of day, with the same phone camera settings each time. Consistency in your setup matters more than the quality of the equipment.
What color metrics quantify teeth whitening effectiveness?
The CIELab color space is the mathematical foundation for all objective teeth whitening results evaluation. It describes color in three dimensions:
- L* measures lightness on a scale from 0 (black) to 100 (white). Whitening treatments primarily increase L*.
- a* measures the red-green axis. Negative values indicate green; positive values indicate red. Teeth typically sit near zero on this axis.
- b* measures the yellow-blue axis. Negative values indicate blue; positive values indicate yellow. Whitening reduces b*, moving teeth away from yellow.
The single most useful metric for measuring whitening progress is ΔE00, calculated using the CIEDE2000 formula. ΔE00 combines changes in L*, a*, and b* into one number that reflects how different two colors appear to the human eye. A ΔE00 below 1.0 is imperceptible to most observers. A value above 3.3 is considered clinically significant and visible without instruments.
The W whiteness index* is a composite metric that weights L* and b* to produce a single whiteness score. In a 2026 randomized controlled trial, W* increased from 72.86 to 78.73 after whitening treatment, a change that corresponds to a visible and meaningful improvement. That 5.87-point gain represents what a well-formulated whitening product can realistically deliver in a controlled setting.
Shade guide units (ΔSGU) translate instrument data into a format that is easier to communicate to patients. In the same 2026 trial, the Vita 3D-Master shade score decreased by 3.68 units after treatment. Each shade guide unit represents a perceptible step toward a lighter, less yellow tooth color.
Tracking L*, a*, and b* over time is necessary to understand the full whitening picture, because a product might increase lightness without reducing yellowness, which produces a different visual result than one that addresses both dimensions.
How do professionals track whitening results over time?
Measuring whitening progress is not a one-time event. Color stability after treatment is as important as the initial result, and rebound effects are well documented.
A standard measurement timeline looks like this:
- Baseline: Taken immediately before treatment begins. This is the reference point for all subsequent comparisons.
- Immediately post-treatment: Captures the maximum whitening effect, though readings at this point can be inflated by temporary dehydration of the enamel.
- One week post-treatment: The most clinically meaningful early measurement. Enamel rehydration is complete, and the true whitening result is visible.
- Six months post-treatment: Reveals early color regression. Some products show significant rebound at this point.
- 12 to 18 months post-treatment: Long-term stability data. Repeated CIEDE2000 measures out to 18 months reveal whether whitening is sustained or whether the tooth color returns toward baseline.
For consumers tracking progress at home, the combination of a shade guide and standardized photography covers most of what you need. You can learn more about at-home whitening evaluation to understand how these methods apply outside a clinical setting. The key is consistency: same location, same lighting, same shade guide, same camera position at every interval.
Interpreting your results requires knowing what counts as a meaningful change. A single shade guide unit of improvement is perceptible. Three or more units is a substantial result. Any product claiming dramatic whitening should be able to point to data showing ΔE00 values above 3.3 or ΔSGU of at least two to three units.
How is whitening product potency measured?
Product potency measurement is a separate discipline from tooth color measurement. Where color assessment uses light spectroscopy and color science, potency testing uses analytical chemistry to verify that a whitening product contains the active ingredient concentration stated on the label.
The three main assays used to measure peroxide concentration in whitening products are:
- Iodometric titration: A classical wet chemistry method that reacts the peroxide with iodine to calculate concentration. It is accurate and inexpensive but requires laboratory conditions.
- HPLC (High-Performance Liquid Chromatography): The gold standard for precise concentration measurement. HPLC separates and quantifies individual compounds, making it ideal for complex formulations.
- Colorimetric and reflectance assays: Faster screening methods used in manufacturing quality control. Less precise than HPLC but practical for lot-to-lot consistency checks.
Validated peroxide assays and sampling plans are what manufacturers use to confirm that every batch of whitening product performs as expected. Without this testing, a product might contain less active ingredient than labeled, producing weaker results than consumers expect.
The distinction between potency and color change is fundamental. Whitening effectiveness and product potency require entirely different measurement approaches. A product can pass potency testing and still produce minimal color change if the delivery system is ineffective. Conversely, a product with lower peroxide concentration can produce strong color results if the formula is well designed. Both measurements matter, but they answer different questions.
For consumers, this means that peroxide concentration alone is not a reliable predictor of whitening results. The clinical color change data, expressed as ΔE00 or ΔSGU, is the more direct measure of what you will actually see in the mirror.
Key takeaways
Teeth whitening effectiveness is best assessed by combining spectrophotometric color data with visual shade guide evaluation across a standardized measurement timeline.
| Point | Details |
|---|---|
| Primary measurement tool | Spectrophotometers like VITA Easyshade V generate L*, a*, b*, and W* values for objective color assessment. |
| Core color metric | ΔE00 (CIEDE2000) quantifies visible color difference; values above 3.3 indicate clinically significant whitening. |
| Standardization requirements | Consistent measurement site, device calibration, lighting control, and single-operator protocol are all required for reliable results. |
| Long-term tracking | Measurements at baseline, one week, six months, and 18 months reveal both whitening effectiveness and color stability over time. |
| Potency vs. color change | Peroxide concentration assays (HPLC, iodometry) measure product quality; color metrics measure actual whitening outcomes. These are separate evaluations. |
Why measurement context matters more than the number
I have spent a lot of time reviewing whitening data, and the single most common mistake I see is treating a single ΔE00 value as the whole story. A number without context is almost meaningless. A ΔE00 of 4.0 measured immediately after treatment looks impressive. The same value measured at six months, after rebound has already occurred, tells a very different story about the product’s real-world performance.
The other thing most people overlook is the b* axis. Most whitening products increase L* (lightness) effectively. Fewer products meaningfully reduce b* (yellowness). Teeth that are lighter but still yellow look different from teeth that are both lighter and less yellow. If you are evaluating a product and only looking at overall ΔE00, you are missing half the picture.
For at-home users, I recommend pairing a Vita 3D-Master shade guide with monthly photographs taken under consistent natural light. It is not as precise as clinical spectrophotometry, but it gives you a real, trackable record. You can explore whitening results explained for a practical breakdown of what realistic progress looks like at different intervals. The goal is not perfection in measurement. The goal is enough consistency to know whether what you are using is actually working.
— Lenney
Track your whitening progress with Getsmilefam

Getsmilefam’s whitening products are designed to deliver results you can actually see and track. The Snow Serum™ Whitening Pen uses BLU Whitening Technology developed in Singapore, with an enamel-safe formula free from harsh hydrogen peroxide, making it suitable for sensitive gums and daily use. For a consistent whitening routine you can monitor over time, the BLU Whitening Toothpaste supports gradual, measurable color improvement with every brush. Both products are formulated to produce visible shade changes that align with the measurement standards covered in this guide. If you are looking for a gentle whitening option that works for sensitive teeth, Getsmilefam has solutions built for exactly that.
FAQ
What is the most accurate way to measure teeth whitening?
Spectrophotometry using the CIELab color space and ΔE00 calculations is the most accurate method. Devices like the VITA Easyshade V generate objective, reproducible color data that removes observer bias from the evaluation.
What does ΔE00 mean in teeth whitening?
ΔE00 is a color difference formula that calculates how visibly different two tooth colors are. A ΔE00 above 3.3 is considered clinically significant, meaning the whitening change is clearly visible to the naked eye.
Can I measure teeth whitening progress at home?
Yes. A Vita 3D-Master shade guide combined with standardized photographs taken under consistent lighting gives you a practical tracking method. While less precise than clinical instruments, this approach reliably shows shade improvements across multiple time points.
How long should I track whitening results?
Clinical studies track color change at baseline, one week, six months, and up to 18 months post-treatment. For home use, monthly check-ins for the first three months, then a six-month follow-up, give you a clear picture of both initial results and color stability.
Is peroxide concentration the same as whitening effectiveness?
No. Peroxide concentration measures product potency, while ΔE00 and shade guide units measure actual color change on the tooth. A product with lower peroxide can outperform a higher-concentration formula if the delivery system is more effective.